Dashboard
The Dashboard is the page you land on after signing in to the Athenty admin portal. It is designed for quick situational awareness: a single screen that tells you what is pending, what changed recently, and what needs a human decision today.
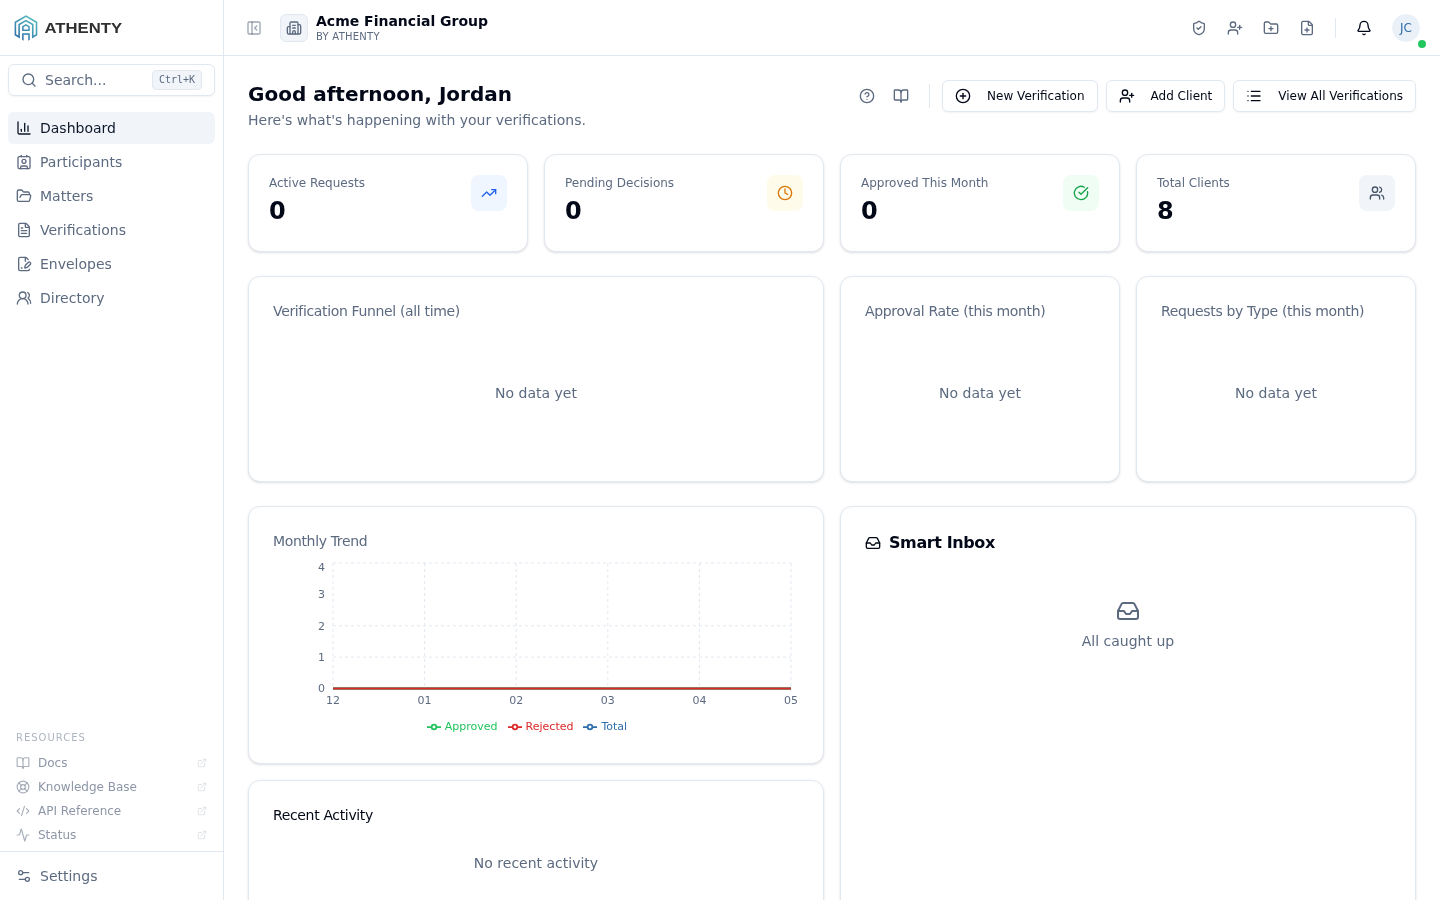
Anatomy of the page
Section titled “Anatomy of the page”1. Status banner
Section titled “1. Status banner”When something is off — a plan limit reached, a billing problem, an active platform incident affecting your tenant — a coloured banner appears at the top of the dashboard with a one-line summary and a link to act on it.
2. Greeting and Quick Actions
Section titled “2. Greeting and Quick Actions”The greeting changes by time of day and addresses you by first name. Immediately to its right, the Quick Actions menu lets you start the most common workflows without navigating away:
- Start a new Verification (Smart IDV or Smart KYC)
- Send a new Envelope
- Open the Smart Planner
3. Help and Docs icons
Section titled “3. Help and Docs icons”In the top-right of the page header, two small icons:
- Help (question mark) — opens an in-page slide-out with a short customer-facing summary of the page (the same content you can read inside the portal without leaving).
- Docs (book) — opens this documentation page in a new tab for the full walkthrough.
These two icons appear on every page in the admin portal. Use Help for a quick reminder; use Docs when you want screenshots and depth.
4. Summary cards
Section titled “4. Summary cards”Counts of pending, in-progress, and completed verifications for the current period, with a delta vs. the previous period. Click any card to drill into the underlying records.
5. Charts row
Section titled “5. Charts row”- Funnel — verification stages from started → completed → approved
- Approval rate — percentage approved in the current window
- Requests by type — distribution across IDV / KYC / Envelope flows
6. Trend chart
Section titled “6. Trend chart”Month-over-month verification volume, useful for spotting seasonality or a sudden drop that warrants investigation.
7. Recent activity
Section titled “7. Recent activity”The last several notifications across your team — assignments, completions, escalations. Click any row to open the related record.
8. Smart Inbox
Section titled “8. Smart Inbox”The platform’s prioritized list of items that need a human decision today, sorted by SLA. Working top-down naturally hits the most urgent items first.
When to use this page
Section titled “When to use this page”- First thing in the morning — plan your day from the Smart Inbox and the summary cards.
- After lunch — catch anything that came in while you were away.
- When a metric looks wrong — click through any card or chart segment to drill into the underlying records.
Permissions and scope
Section titled “Permissions and scope”All counts and activity are scoped to your Organization. Admins see tenant-wide totals; members see what is assigned to them. If your numbers look surprising, double-check the date filter on your profile and confirm your role with an admin.
Related pages
Section titled “Related pages”- Verifications — full list view and filters
- Envelopes — create and track envelopes
- Notifications — full notification feed